
Warrington's claimant count hit 3,655 in August, the highest since June 2022, and the whole rise was under-25s. Only seven North West areas are lower.
3,655 people in Warrington borough were claiming unemployment-related benefits in August. That is the highest the count has been since June 2022, and it is the fifth fastest annual rise of the 35 local authority areas in the North West.
The whole of the month’s increase, and more, came from people under 25.
The figures come from the ONS claimant count published through nomis on 15 September, the monthly count of people claiming Universal Credit or Jobseeker’s Allowance principally because they are out of work.
- 3,655 claimants in August, up 50 on July and up 225 on August 2025
- 2.7% of residents aged 16 to 64, against 4.2% across the North West and 4.0% in England
- 865 claimants aged 16 to 24, the most since September 2021
- the count has now risen in each of the seven months since January, from 3,365
The rise is entirely young people
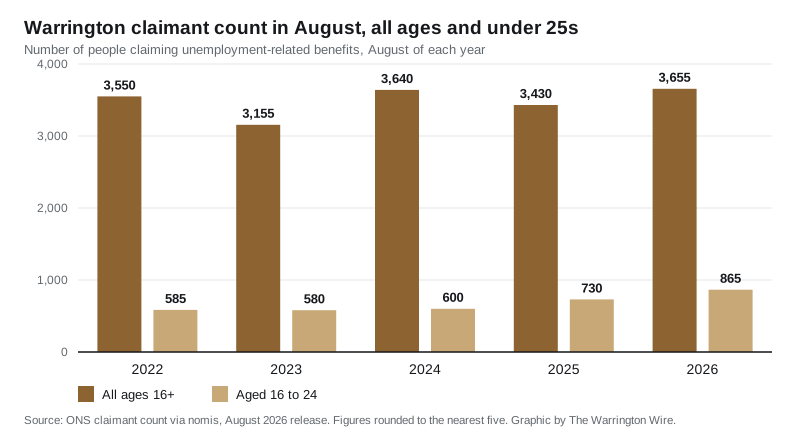
Between July and August the number of claimants aged 16 to 24 rose by 65, to 865. The 25 to 49 group did not move at all, staying at 2,030. The 50 and over group fell by 15, to 760.
Under-25s are now 23.7% of all claimants in the borough. A year ago they were 21.3%. The August figure has climbed in each of the last three years:
| August | Aged 16 to 24 | All ages |
|---|---|---|
| 2022 | 585 | 3,550 |
| 2023 | 580 | 3,155 |
| 2024 | 600 | 3,640 |
| 2025 | 730 | 3,430 |
| 2026 | 865 | 3,655 |
Some of an August jump is seasonal, because school and college leavers appear in the count for the first time. That is worth saying plainly, and it does not explain all of this one. Across the North West, under-25 claimants rose 5.3% between July and August, from 41,905 to 44,110. Warrington’s rose 8.1%.
Over the year the gap is wider still. Warrington’s under-25 count is up 18.5% on August 2025, the ninth largest increase of the 35 North West areas, against 10.0% for the region as a whole.
One more thing about that number. The ONS notes in its quality report that people in full-time education “will not generally be eligible for unemployment benefits while searching for work, which particularly affects 18- to 21-year-olds”, and that 16 and 17 year olds qualify only in extreme circumstances. So these 865 are, in the main, young people who are not in education.
Low by North West standards, but rising fast
Warrington’s rate of 2.7% is one of the lowest in the region. Only seven of the 35 North West areas are lower, and Warrington is level with Fylde. Westmorland and Furness and Ribble Valley share the lowest rate at 1.8%. Oldham has the highest at 6.5%, with Manchester and Rochdale on 6.0%.
Among its neighbours, Cheshire East is on 2.4%, Cheshire West and Chester 2.6%, Trafford 3.0%, Wigan 3.6%, St Helens 3.7% and Halton 4.3%.
The direction of travel is the other way round. Warrington’s count is up 6.6% on a year ago, the fifth largest rise in the region behind Ribble Valley (10.5%), Wyre (10.3%), Cheshire East (9.3%) and Hyndburn (7.2%). Five North West areas recorded a fall, led by Pendle at 3.6% down. St Helens and Wirral are both slightly below where they were a year ago.
What this figure is, and what it is not
The claimant count is not the unemployment rate, and the ONS is direct about that. Its quality report says the count “does not attempt to measure unemployment, which is a concept defined by the International Labour Organisation (ILO) as all those who are out of work, actively seeking work and available to start work”. It measures “the number of people claiming benefits principally for the reason of being unemployed, based on administrative data from the benefits system”, which since Universal Credit includes people already in work on low earnings who are still required to look for more.
Two smaller points that matter when you compare our figures with anyone else’s. Local figures are rounded to the nearest five before publication. And the Universal Credit part of the count can be revised for one previous month, so the most recent figure in any release is the one most likely to change slightly next time. We will say so here if August’s 3,655 moves when the September figures are published next month.
What it means for you
If you are out of work, or working and still short, there are two local routes worth knowing about before the emergency stage.
- The council’s Crisis and Resilience Fund can make crisis payments and housing payments, and from this month its advice side is being run by an alliance of local charities. We have written about who is delivering it and what you can apply for.
- Citizens Advice Warrington runs a drop-in at The Gateway, 89 Sankey Street, from 9.30am to 1pm Monday to Friday, listed on its own website.
If your income has dropped, it is also worth checking whether your council tax band and any support you qualify for have been reviewed. Our guide to Warrington council tax bands and charges sets out what each band costs in every parish, and Warrington house prices tracks the other half of the household picture.
Sources: ONS claimant count, August 2026 release, via nomis (dataset NM_162_1, geography E06000007 for Warrington and E12000002 for the North West); ONS Claimant Count Quality and Methodology Information.
Have your say